1F5R

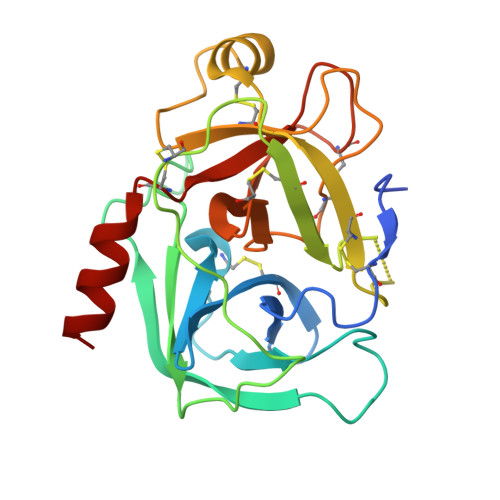
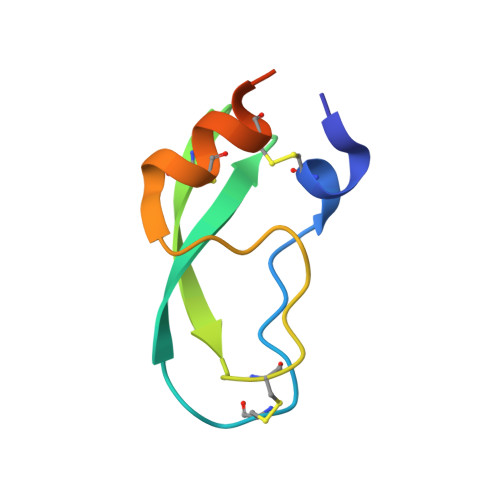
RAT TRYPSINOGEN MUTANT COMPLEXED WITH BOVINE PANCREATIC TRYPSIN INHIBITOR


Experimental Data Snapshot

  • Method: X-RAY DIFFRACTION
  • Resolution: 1.65 Å
  • R-Value Free: 0.220 
  • R-Value Work: 0.189 

wwPDB Validation   3D Report Full Report


This is version 1.4 of the entry. See complete history


Literature

The energetic cost of induced fit catalysis: Crystal structures of trypsinogen mutants with enhanced activity and inhibitor affinity.

Pasternak, A.White, A.Jeffery, C.J.Medina, N.Cahoon, M.Ringe, D.Hedstrom, L.

(2001) Protein Sci 10: 1331-1342

  • DOI: https://doi.org/10.1110/ps.44101
  • Primary Citation of Related Structures:  
    1F5R, 1F7Z, 1FY8, 3TGK

  • PubMed Abstract: 

    The contribution of induced fit to enzyme specificity has been much debated, although with little experimental data. Here we probe the effect of induced fit on enzyme specificity using the trypsin(ogen) system. BPTI is known to induce trypsinogen to assume a trypsinlike conformation. Correlations are observed between BPTI affinity and the values of k(cat)/K(m) for the hydrolysis of two substrates by eight trypsin(ogen) variants. The slope of both correlations is -1.8. The crystal structures of the BPTI complexes of four variant trypsinogens were also solved. Three of these enzymes, K15A, DeltaI16V17/D194N, and DeltaI16V17/Q156K trypsinogen, are 10- to 100-fold more active than trypsinogen. The fourth variant, DeltaI16V17 trypsinogen, is the lone outlier in the correlations; its activity is lower than expected based on its affinity for BPTI. The S1 site and oxyanion hole, formed by segments 184A-194 and 216-223, are trypsinlike in all of the enzymes. These structural and kinetic data confirm that BPTI induces an active conformation in the trypsin(ogen) variants. Thus, changes in BPTI affinity monitor changes in the energetic cost of inducing a trypsinlike conformation. Although the S1 site and oxyanion hole are similar in all four variants, the N-terminal and autolysis loop (residues 142-152) segments have different interactions for each variant. These results indicate that zymogen activity is controlled by a simple conformational equilibrium between active and inactive conformations, and that the autolysis loop and N-terminal segments control this equilibrium. Together, these data illustrate that induced fit does not generally contribute to enzyme specificity.


  • Organizational Affiliation

    Department of Chemistry, Brandeis University, Waltham, Massachusetts 02454, USA.


Macromolecules
Find similar proteins by:  (by identity cutoff)  |  3D Structure
Entity ID: 1
MoleculeChains Sequence LengthOrganismDetailsImage
TRYPSIN II, ANIONIC231Rattus norvegicusMutation(s): 1 
EC: 3.4.21.4
UniProt
Find proteins for P00763 (Rattus norvegicus)
Explore P00763 
Go to UniProtKB:  P00763
Entity Groups  
Sequence Clusters30% Identity50% Identity70% Identity90% Identity95% Identity100% Identity
UniProt GroupP00763
Sequence Annotations
Expand
  • Reference Sequence
Find similar proteins by:  (by identity cutoff)  |  3D Structure
Entity ID: 2
MoleculeChains Sequence LengthOrganismDetailsImage
PANCREATIC TRYPSIN INHIBITORB [auth I]65Bos taurusMutation(s): 0 
UniProt
Find proteins for P00974 (Bos taurus)
Explore P00974 
Go to UniProtKB:  P00974
Entity Groups  
Sequence Clusters30% Identity50% Identity70% Identity90% Identity95% Identity100% Identity
UniProt GroupP00974
Sequence Annotations
Expand
  • Reference Sequence
Small Molecules
Ligands 1 Unique
IDChains Name / Formula / InChI Key2D Diagram3D Interactions
CA
Query on CA

Download Ideal Coordinates CCD File 
C [auth A]CALCIUM ION
Ca
BHPQYMZQTOCNFJ-UHFFFAOYSA-N
Experimental Data & Validation

Experimental Data

  • Method: X-RAY DIFFRACTION
  • Resolution: 1.65 Å
  • R-Value Free: 0.220 
  • R-Value Work: 0.189 
  • Space Group: P 32 2 1
Unit Cell:
Length ( Å )Angle ( ˚ )
a = 92.568α = 90
b = 92.568β = 90
c = 62.126γ = 120
Software Package:
Software NamePurpose
DENZOdata reduction
SCALEPACKdata scaling
CNSrefinement
CNSphasing

Structure Validation

View Full Validation Report


Entry History 

Deposition Data

Revision History  (Full details and data files)

  • Version 1.0: 2001-07-04
    Type: Initial release
  • Version 1.1: 2008-04-27
    Changes: Version format compliance
  • Version 1.2: 2011-07-13
    Changes: Version format compliance
  • Version 1.3: 2021-11-03
    Changes: Database references, Derived calculations
  • Version 1.4: 2024-11-20
    Changes: Data collection, Structure summary