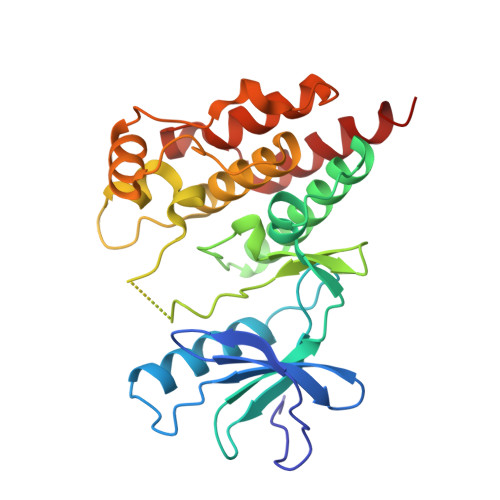
1UWH

The complex of wild type B-RAF and BAY439006.


Experimental Data Snapshot

  • Method: X-RAY DIFFRACTION
  • Resolution: 2.95 Å
  • R-Value Free: 0.257 
  • R-Value Work: 0.222 
  • R-Value Observed: 0.222 

Starting Models: experimental
View more details

wwPDB Validation   3D Report Full Report


Ligand Structure Quality Assessment 


This is version 1.3 of the entry. See complete history


Literature

Mechanism of Activation of the Raf-Erk Signaling Pathway by Oncogenic Mutations of B-Raf

Wan, P.T.C.Garnett, M.J.Roe, S.M.Lee, S.Niculescu-Duvaz, D.Good, V.M.Jones, C.M.Marshall, C.J.Springer, C.J.Barford, D.Marais, R.

(2004) Cell 116: 855

  • DOI: https://doi.org/10.1016/s0092-8674(04)00215-6
  • Primary Citation of Related Structures:  
    1UWH, 1UWJ

  • PubMed Abstract: 

    Over 30 mutations of the B-RAF gene associated with human cancers have been identified, the majority of which are located within the kinase domain. Here we show that of 22 B-RAF mutants analyzed, 18 have elevated kinase activity and signal to ERK in vivo. Surprisingly, three mutants have reduced kinase activity towards MEK in vitro but, by activating C-RAF in vivo, signal to ERK in cells. The structures of wild type and oncogenic V599EB-RAF kinase domains in complex with the RAF inhibitor BAY43-9006 show that the activation segment is held in an inactive conformation by association with the P loop. The clustering of most mutations to these two regions suggests that disruption of this interaction converts B-RAF into its active conformation. The high activity mutants signal to ERK by directly phosphorylating MEK, whereas the impaired activity mutants stimulate MEK by activating endogenous C-RAF, possibly via an allosteric or transphosphorylation mechanism.


  • Organizational Affiliation

    Section of Structural Biology, The Institute of Cancer Research, Chester Beatty Laboratories, 237 Fulham Road, London SW3 6JB, UK.


Macromolecules
Find similar proteins by:  (by identity cutoff)  |  3D Structure
Entity ID: 1
MoleculeChains Sequence LengthOrganismDetailsImage
B-RAF PROTO-ONCOGENE SERINE/THREONINE-PROTEIN KINASE
A, B
276Homo sapiensMutation(s): 0 
EC: 2.7.1.37 (PDB Primary Data), 2.7.11.1 (PDB Primary Data)
UniProt & NIH Common Fund Data Resources
Find proteins for P15056 (Homo sapiens)
Explore P15056 
Go to UniProtKB:  P15056
PHAROS:  P15056
GTEx:  ENSG00000157764 
Entity Groups  
Sequence Clusters30% Identity50% Identity70% Identity90% Identity95% Identity100% Identity
UniProt GroupP15056
Sequence Annotations
Expand
  • Reference Sequence
Small Molecules
Binding Affinity Annotations 
IDSourceBinding Affinity
BAX BindingDB:  1UWH Ki: min: 22, max: 38 (nM) from 2 assay(s)
Kd: min: 260, max: 540 (nM) from 3 assay(s)
IC50: min: 4.4, max: 2.20e+4 (nM) from 29 assay(s)
EC50: 3 (nM) from 1 assay(s)
PDBBind:  1UWH IC50: 22 (nM) from 1 assay(s)
Experimental Data & Validation

Experimental Data

  • Method: X-RAY DIFFRACTION
  • Resolution: 2.95 Å
  • R-Value Free: 0.257 
  • R-Value Work: 0.222 
  • R-Value Observed: 0.222 
  • Space Group: P 41 21 2
Unit Cell:
Length ( Å )Angle ( ˚ )
a = 110.28α = 90
b = 110.28β = 90
c = 143.01γ = 90
Software Package:
Software NamePurpose
CNSrefinement
MOSFLMdata reduction
SCALAdata scaling
BEASTphasing

Structure Validation

View Full Validation Report


Ligand Structure Quality Assessment 


Entry History 

Deposition Data

Revision History  (Full details and data files)

  • Version 1.0: 2004-03-19
    Type: Initial release
  • Version 1.1: 2012-10-03
    Changes: Derived calculations, Non-polymer description, Other, Refinement description, Source and taxonomy, Structure summary, Version format compliance
  • Version 1.2: 2018-01-17
    Changes: Structure summary
  • Version 1.3: 2023-12-13
    Changes: Data collection, Database references, Derived calculations, Other, Refinement description