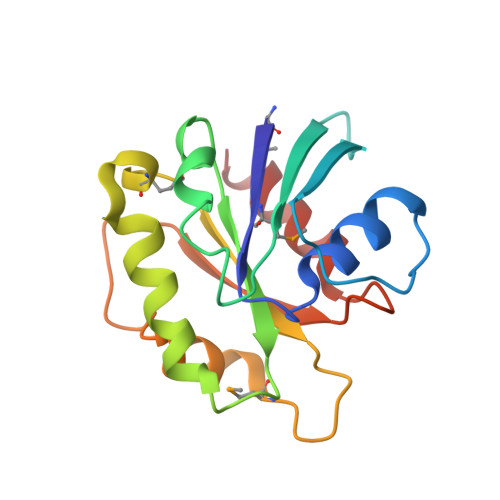
3PCR

Structure of EspG-Arf6 complex


Experimental Data Snapshot

  • Method: X-RAY DIFFRACTION
  • Resolution: 2.50 Å
  • R-Value Free: 0.326 
  • R-Value Work: 0.223 
  • R-Value Observed: 0.228 

wwPDB Validation   3D Report Full Report


Ligand Structure Quality Assessment 


This is version 1.2 of the entry. See complete history


Literature

The assembly of a GTPase-kinase signalling complex by a bacterial catalytic scaffold.

Selyunin, A.S.Sutton, S.E.Weigele, B.A.Reddick, L.E.Orchard, R.C.Bresson, S.M.Tomchick, D.R.Alto, N.M.

(2011) Nature 469: 107-111

  • DOI: https://doi.org/10.1038/nature09593
  • Primary Citation of Related Structures:  
    3PCR, 3PCS

  • PubMed Abstract: 

    The fidelity and specificity of information flow within a cell is controlled by scaffolding proteins that assemble and link enzymes into signalling circuits. These circuits can be inhibited by bacterial effector proteins that post-translationally modify individual pathway components. However, there is emerging evidence that pathogens directly organize higher-order signalling networks through enzyme scaffolding, and the identity of the effectors and their mechanisms of action are poorly understood. Here we identify the enterohaemorrhagic Escherichia coli O157:H7 type III effector EspG as a regulator of endomembrane trafficking using a functional screen, and report ADP-ribosylation factor (ARF) GTPases and p21-activated kinases (PAKs) as its relevant host substrates. The 2.5 Å crystal structure of EspG in complex with ARF6 shows how EspG blocks GTPase-activating-protein-assisted GTP hydrolysis, revealing a potent mechanism of GTPase signalling inhibition at organelle membranes. In addition, the 2.8 Å crystal structure of EspG in complex with the autoinhibitory Iα3-helix of PAK2 defines a previously unknown catalytic site in EspG and provides an allosteric mechanism of kinase activation by a bacterial effector. Unexpectedly, ARF and PAKs are organized on adjacent surfaces of EspG, indicating its role as a 'catalytic scaffold' that effectively reprograms cellular events through the functional assembly of GTPase-kinase signalling complex.


  • Organizational Affiliation

    Department of Microbiology, University of Texas Southwestern Medical Center, 5323 Harry Hines Boulevard, Dallas, Texas 75390-8816, USA.


Macromolecules
Find similar proteins by:  (by identity cutoff)  |  3D Structure
Entity ID: 1
MoleculeChains Sequence LengthOrganismDetailsImage
EspG357Escherichia coli O157:H7Mutation(s): 0 
Gene Names: ECs4590espGZ5142
UniProt
Find proteins for Q7DB50 (Escherichia coli O157:H7)
Explore Q7DB50 
Go to UniProtKB:  Q7DB50
Entity Groups  
Sequence Clusters30% Identity50% Identity70% Identity90% Identity95% Identity100% Identity
UniProt GroupQ7DB50
Sequence Annotations
Expand
  • Reference Sequence
Find similar proteins by:  (by identity cutoff)  |  3D Structure
Entity ID: 2
MoleculeChains Sequence LengthOrganismDetailsImage
ADP-ribosylation factor 6162Homo sapiensMutation(s): 0 
Gene Names: ARF6
EC: 3.6.5.2
UniProt & NIH Common Fund Data Resources
Find proteins for P62330 (Homo sapiens)
Explore P62330 
Go to UniProtKB:  P62330
PHAROS:  P62330
GTEx:  ENSG00000165527 
Entity Groups  
Sequence Clusters30% Identity50% Identity70% Identity90% Identity95% Identity100% Identity
UniProt GroupP62330
Sequence Annotations
Expand
  • Reference Sequence
Small Molecules
Modified Residues  1 Unique
IDChains TypeFormula2D DiagramParent
MSE
Query on MSE
A
L-PEPTIDE LINKINGC5 H11 N O2 SeMET
Experimental Data & Validation

Experimental Data

  • Method: X-RAY DIFFRACTION
  • Resolution: 2.50 Å
  • R-Value Free: 0.326 
  • R-Value Work: 0.223 
  • R-Value Observed: 0.228 
  • Space Group: P 43 21 2
Unit Cell:
Length ( Å )Angle ( ˚ )
a = 104.566α = 90
b = 104.566β = 90
c = 98.238γ = 90
Software Package:
Software NamePurpose
SCALEPACKdata scaling
PHENIXrefinement
PDB_EXTRACTdata extraction
HKL-3000data collection
HKL-3000data reduction
MLPHAREphasing

Structure Validation

View Full Validation Report


Ligand Structure Quality Assessment 


Entry History 

Deposition Data

Revision History  (Full details and data files)

  • Version 1.0: 2011-01-05
    Type: Initial release
  • Version 1.1: 2011-07-13
    Changes: Source and taxonomy, Version format compliance
  • Version 1.2: 2024-10-30
    Changes: Data collection, Database references, Derived calculations, Structure summary