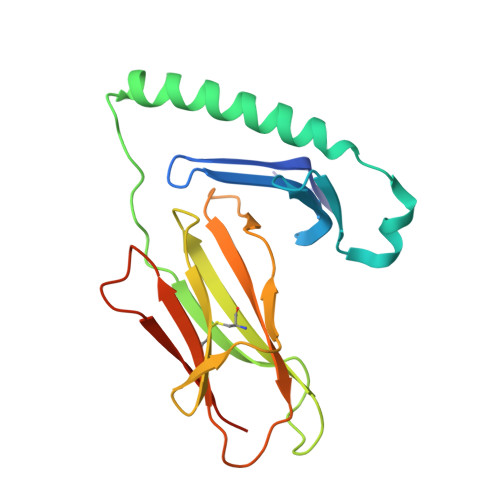
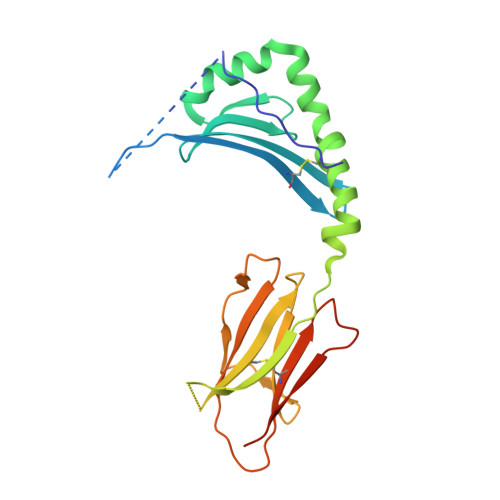
6MFF

HLA-DQ2-glia-omega1


Experimental Data Snapshot

  • Method: X-RAY DIFFRACTION
  • Resolution: 2.60 Å
  • R-Value Free: 0.250 
  • R-Value Work: 0.209 
  • R-Value Observed: 0.211 

wwPDB Validation   3D Report Full Report


Ligand Structure Quality Assessment 


This is version 1.4 of the entry. See complete history


Literature

Discriminative T-cell receptor recognition of highly homologous HLA-DQ2-bound gluten epitopes.

Dahal-Koirala, S.Ciacchi, L.Petersen, J.Risnes, L.F.Neumann, R.S.Christophersen, A.Lundin, K.E.A.Reid, H.H.Qiao, S.W.Rossjohn, J.Sollid, L.M.

(2019) J Biol Chem 294: 941-952

  • DOI: https://doi.org/10.1074/jbc.RA118.005736
  • Primary Citation of Related Structures:  
    6MFF, 6MFG

  • PubMed Abstract: 

    Celiac disease (CeD) provides an opportunity to study the specificity underlying human T-cell responses to an array of similar epitopes presented by the same human leukocyte antigen II (HLA-II) molecule. Here, we investigated T-cell responses to the two immunodominant and highly homologous HLA-DQ2.5-restricted gluten epitopes, DQ2.5-glia-α1a (PFPQPELPY) and DQ2.5-glia-ω1 (PFPQPEQPF). Using HLA-DQ2.5-DQ2.5-glia-α1a and HLA-DQ2.5-DQ2.5-glia-ω1 tetramers and single-cell αβ T-cell receptor (TCR) sequencing, we observed that despite similarity in biased variable-gene usage in the TCR repertoire responding to these nearly identical peptide-HLA-II complexes, most of the T cells are specific for either of the two epitopes. To understand the molecular basis of this exquisite fine specificity, we undertook Ala substitution assays revealing that the p7 residue (Leu/Gln) is critical for specific epitope recognition by both DQ2.5-glia-α1a- and DQ2.5-glia-ω1-reactive T-cell clones. We determined high-resolution binary crystal structures of HLA-DQ2.5 bound to DQ2.5-glia-α1a (2.0 Å) and DQ2.5-glia-ω1 (2.6 Å). These structures disclosed that differences around the p7 residue subtly alter the neighboring substructure and electrostatic properties of the HLA-DQ2.5-peptide complex, providing the fine specificity underlying the responses against these two highly homologous gluten epitopes. This study underscores the ability of TCRs to recognize subtle differences in the peptide-HLA-II landscape in a human disease setting.


  • Organizational Affiliation

    From the Department of Immunology, University of Oslo and Oslo University Hospital-Rikshospitalet, 0372 Oslo, Norway.


Macromolecules
Find similar proteins by:  (by identity cutoff)  |  3D Structure
Entity ID: 1
MoleculeChains Sequence LengthOrganismDetailsImage
HLA class II histocompatibility antigen, DQ alpha 1 chain190Homo sapiensMutation(s): 0 
Gene Names: HLA-DQA1
UniProt & NIH Common Fund Data Resources
Find proteins for P01909 (Homo sapiens)
Explore P01909 
Go to UniProtKB:  P01909
PHAROS:  P01909
GTEx:  ENSG00000196735 
Entity Groups  
Sequence Clusters30% Identity50% Identity70% Identity90% Identity95% Identity100% Identity
UniProt GroupP01909
Glycosylation
Glycosylation Sites: 2Go to GlyGen: P01909-1
Sequence Annotations
Expand
  • Reference Sequence
Find similar proteins by:  (by identity cutoff)  |  3D Structure
Entity ID: 2
MoleculeChains Sequence LengthOrganismDetailsImage
MHC class II HLA-DQ-beta-1 - DQ2-glia-omega1 chimeric proteinB [auth C]226Homo sapiensMutation(s): 0 
UniProt
Find proteins for O19712 (Homo sapiens)
Explore O19712 
Go to UniProtKB:  O19712
Entity Groups  
Sequence Clusters30% Identity50% Identity70% Identity90% Identity95% Identity100% Identity
UniProt GroupO19712
Sequence Annotations
Expand
  • Reference Sequence
Experimental Data & Validation

Experimental Data

  • Method: X-RAY DIFFRACTION
  • Resolution: 2.60 Å
  • R-Value Free: 0.250 
  • R-Value Work: 0.209 
  • R-Value Observed: 0.211 
  • Space Group: C 2 2 21
Unit Cell:
Length ( Å )Angle ( ˚ )
a = 93.87α = 90
b = 96.61β = 90
c = 107.05γ = 90
Software Package:
Software NamePurpose
PHENIXrefinement
XDSdata reduction
SCALAdata scaling
PHASERphasing

Structure Validation

View Full Validation Report


Ligand Structure Quality Assessment 


Entry History 

Deposition Data

Revision History  (Full details and data files)

  • Version 1.0: 2018-11-21
    Type: Initial release
  • Version 1.1: 2018-12-12
    Changes: Data collection, Database references
  • Version 1.2: 2019-01-30
    Changes: Data collection, Database references
  • Version 1.3: 2020-07-29
    Type: Remediation
    Reason: Carbohydrate remediation
    Changes: Data collection, Derived calculations, Structure summary
  • Version 1.4: 2024-10-23
    Changes: Data collection, Database references, Structure summary