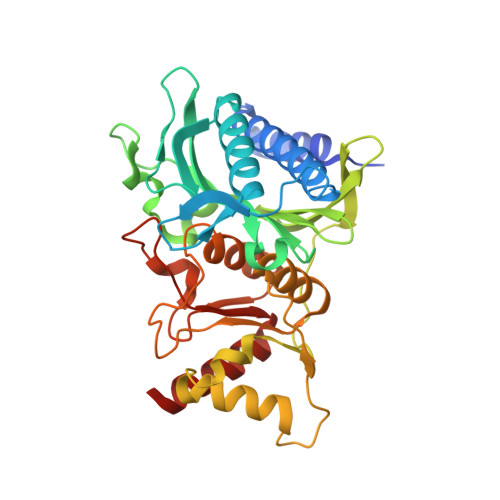
1YYZ

R-State AMP Complex Reveals Initial Steps of the Quaternary Transition of Fructose-1,6-bisphosphatase


Experimental Data Snapshot

  • Method: X-RAY DIFFRACTION
  • Resolution: 1.85 Å
  • R-Value Free: 0.266 
  • R-Value Work: 0.223 
  • R-Value Observed: 0.223 

Starting Model: experimental
View more details

wwPDB Validation   3D Report Full Report


Ligand Structure Quality Assessment 


This is version 1.7 of the entry. See complete history


Literature

R-state AMP complex reveals initial steps of the quaternary transition of fructose-1,6-bisphosphatase.

Iancu, C.V.Mukund, S.Fromm, H.J.Honzatko, R.B.

(2005) J Biol Chem 280: 19737-19745

  • DOI: https://doi.org/10.1074/jbc.M501011200
  • Primary Citation of Related Structures:  
    1YXI, 1YYZ, 1YZ0

  • PubMed Abstract: 

    AMP transforms fructose-1,6-bisphosphatase from its active R-state to its inactive T-state; however, the mechanism of that transformation is poorly understood. The mutation of Ala(54) to leucine destabilizes the T-state of fructose-1,6-bisphosphatase. The mutant enzyme retains wild-type levels of activity, but the concentration of AMP that causes 50% inhibition increases 50-fold. In the absence of AMP, the Leu(54) enzyme adopts an R-state conformation nearly identical to that of the wild-type enzyme. The mutant enzyme, however, grows in two crystal forms in the presence of saturating AMP. In one form, the AMP-bound tetramer is in a T-like conformation, whereas in the other form, the AMP-bound tetramer is in a R-like conformation. The latter reveals conformational changes in two helices due to the binding of AMP. Helix H1 moves toward the center of the tetramer and displaces Ile(10) from a hydrophobic pocket. The displacement of Ile(10) exposes a hydrophobic surface critical to interactions that stabilize the T-state. Helix H2 moves away from the center of the tetramer, breaking hydrogen bonds with a buried loop (residues 187-195) in an adjacent subunit. The same hydrogen bonds reform but only after the quaternary transition to the T-state. Proposed here is a model that accounts for the quaternary transition and cooperativity in the inhibition of catalysis by AMP.


  • Organizational Affiliation

    Department of Biochemistry, Biophysics, and Molecular Biology, Iowa State University, Ames, 50011, USA.


Macromolecules
Find similar proteins by:  (by identity cutoff)  |  3D Structure
Entity ID: 1
MoleculeChains Sequence LengthOrganismDetailsImage
Fructose-1,6-bisphosphatase337Sus scrofaMutation(s): 1 
Gene Names: FBP1FBP
EC: 3.1.3.11
UniProt
Find proteins for P00636 (Sus scrofa)
Explore P00636 
Go to UniProtKB:  P00636
Entity Groups  
Sequence Clusters30% Identity50% Identity70% Identity90% Identity95% Identity100% Identity
UniProt GroupP00636
Sequence Annotations
Expand
  • Reference Sequence
Small Molecules
Ligands 4 Unique
IDChains Name / Formula / InChI Key2D Diagram3D Interactions
AMP
Query on AMP

Download Ideal Coordinates CCD File 
F [auth A]ADENOSINE MONOPHOSPHATE
C10 H14 N5 O7 P
UDMBCSSLTHHNCD-KQYNXXCUSA-N
F6P
Query on F6P

Download Ideal Coordinates CCD File 
B [auth A]6-O-phosphono-beta-D-fructofuranose
C6 H13 O9 P
BGWGXPAPYGQALX-ARQDHWQXSA-N
PO4
Query on PO4

Download Ideal Coordinates CCD File 
C [auth A]PHOSPHATE ION
O4 P
NBIIXXVUZAFLBC-UHFFFAOYSA-K
MG
Query on MG

Download Ideal Coordinates CCD File 
D [auth A],
E [auth A]
MAGNESIUM ION
Mg
JLVVSXFLKOJNIY-UHFFFAOYSA-N
Binding Affinity Annotations 
IDSourceBinding Affinity
AMP BindingDB:  1YYZ IC50: min: 140, max: 9800 (nM) from 10 assay(s)
Experimental Data & Validation

Experimental Data

  • Method: X-RAY DIFFRACTION
  • Resolution: 1.85 Å
  • R-Value Free: 0.266 
  • R-Value Work: 0.223 
  • R-Value Observed: 0.223 
  • Space Group: I 2 2 2
Unit Cell:
Length ( Å )Angle ( ˚ )
a = 53.78α = 90
b = 82.56β = 90
c = 166.6γ = 90
Software Package:
Software NamePurpose
AMoREphasing
CNSrefinement

Structure Validation

View Full Validation Report


Ligand Structure Quality Assessment 


Entry History 

Deposition Data

Revision History  (Full details and data files)

  • Version 1.0: 2005-03-15
    Type: Initial release
  • Version 1.1: 2008-04-30
    Changes: Version format compliance
  • Version 1.2: 2011-07-13
    Changes: Version format compliance
  • Version 1.3: 2011-11-16
    Changes: Atomic model
  • Version 1.4: 2017-10-11
    Changes: Refinement description
  • Version 1.5: 2020-07-29
    Type: Remediation
    Reason: Carbohydrate remediation
    Changes: Data collection, Derived calculations, Structure summary
  • Version 1.6: 2021-10-20
    Changes: Database references, Structure summary
  • Version 1.7: 2023-08-23
    Changes: Data collection, Refinement description