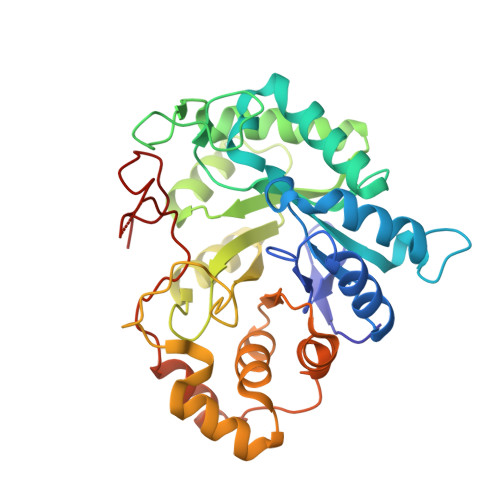
3H4G

Structure of aldehyde reductase holoenzyme in complex with potent aldose reductase inhibitor Fidarestat: Implications for inhibitor binding and selectivity


Experimental Data Snapshot

  • Method: X-RAY DIFFRACTION
  • Resolution: 1.85 Å
  • R-Value Free: 0.216 
  • R-Value Work: 0.183 
  • R-Value Observed: 0.185 

Starting Model: experimental
View more details

wwPDB Validation   3D Report Full Report


Ligand Structure Quality Assessment 


This is version 1.2 of the entry. See complete history


Literature

Structure of aldehyde reductase holoenzyme in complex with the potent aldose reductase inhibitor fidarestat: implications for inhibitor binding and selectivity

El-Kabbani, O.Carbone, V.Darmanin, C.Oka, M.Mitschler, A.Podjarny, A.Schulze-Briese, C.Chung, R.P.

(2005) J Med Chem 48: 5536-5542

  • DOI: https://doi.org/10.1021/jm050412o
  • Primary Citation of Related Structures:  
    3H4G

  • PubMed Abstract: 

    Structure determination of porcine aldehyde reductase holoenzyme in complex with the potent aldose reductase inhibitor fidarestat was carried out to explain the difference in the potency of the inhibitor for aldose and aldehyde reductases. The hydrogen bonds between the active-site residues Tyr50, His113, and Trp114 and fidarestat are conserved in the two enzymes. In aldose reductase, Leu300 forms a hydrogen bond through its main-chain nitrogen atom with the exocyclic amide group of the inhibitor, which when replaced with a Pro in aldehyde reductase, cannot form a hydrogen bond, thus causing a loss in binding energy. Furthermore, in aldehyde reductase, the side chain of Trp220 occupies a disordered split conformation that is not observed in aldose reductase. Molecular modeling and inhibitory activity measurements suggest that the difference in the interaction between the side chain of Trp220 and fidarestat may contribute to the difference in the binding of the inhibitor to the enzymes.


  • Organizational Affiliation

    Department of Medicinal Chemistry, Victorian College of Pharmacy, Monash University (Parkville Campus), 381 Royal Parade, Vic 3052, Australia. Ossama.El-Kabbani@ vcp.monash.edu.au


Macromolecules
Find similar proteins by:  (by identity cutoff)  |  3D Structure
Entity ID: 1
MoleculeChains Sequence LengthOrganismDetailsImage
Alcohol dehydrogenase [NADP+]325Sus scrofaMutation(s): 0 
EC: 1.1.1.2 (PDB Primary Data), 1.6 (UniProt), 1.1.1.20 (UniProt), 1.1.1.19 (UniProt), 1.1.1.372 (UniProt), 1.1.1.54 (UniProt)
UniProt
Find proteins for P50578 (Sus scrofa)
Explore P50578 
Go to UniProtKB:  P50578
Entity Groups  
Sequence Clusters30% Identity50% Identity70% Identity90% Identity95% Identity100% Identity
UniProt GroupP50578
Sequence Annotations
Expand
  • Reference Sequence
Small Molecules
Binding Affinity Annotations 
IDSourceBinding Affinity
FID BindingDB:  3H4G IC50: min: 1200, max: 2500 (nM) from 2 assay(s)
Experimental Data & Validation

Experimental Data

  • Method: X-RAY DIFFRACTION
  • Resolution: 1.85 Å
  • R-Value Free: 0.216 
  • R-Value Work: 0.183 
  • R-Value Observed: 0.185 
  • Space Group: P 65 2 2
Unit Cell:
Length ( Å )Angle ( ˚ )
a = 67.301α = 90
b = 67.301β = 90
c = 244.741γ = 120
Software Package:
Software NamePurpose
HKL-2000data collection
MOLREPphasing
REFMACrefinement
HKL-2000data scaling

Structure Validation

View Full Validation Report


Ligand Structure Quality Assessment 


Entry History 

Deposition Data

Revision History  (Full details and data files)

  • Version 1.0: 2009-05-05
    Type: Initial release
  • Version 1.1: 2011-07-13
    Changes: Version format compliance
  • Version 1.2: 2023-11-01
    Changes: Data collection, Database references, Derived calculations, Refinement description